Climate Data Analysis
How big data can make pollution small
The ability to collect and analyze massive amounts of data is transforming research in the natural and social sciences. And yet, the climate change adaptation community has largely overlooked these developments. “Big data” can inform adaptation research and decision-making and outline what’s needed from the adaptation community to maximize this opportunity.
Environmental data are growing in complexity, size, and resolution, and successfully synthesizing heterogeneous data from multiple sources to support holistic analyses and extraction of new knowledge requires application of Data Science.

The value of “big data” is determined by our ability to analyze and interpret large datasets in ways that are meaningful, rigorous and informative, combined with “small data” approaches. There are two dominant approaches to combining big and small data: a data-driven approach uses big datasets to explore emergent patterns and trends in data sources, informing the development of small data studies to investigate observed patterns, and a “theory-driven” approach, that begins with adaptation theory and case studies to identify hypotheses that can be tested with big datasets, seeking to identify generalizable insights and test prevailing theories.
An overall conclusion is that big bata for climate change adaptation, as with nearly everything with big data, is still relatively new; most existing applications are small pilots, few formal evaluations exist, and much of the field consists of studies from case studies and reports from NGOs, humanitarian organizations, and private companies. But based on the evidence available so far, big data does show real value and potential as a force for increasing social resilience, provided it is approached and promoted not merely as yet another technological fix. Generally speaking, and particularly in disaster prone regions, we find that big data can have four main roles or functions:
- Descriptive, involves narrative or early detection such as using data from satellite imagery to identify flooded areas or identifying areas in need from crisis maps;
- Predictive, includes what has been called ‘now-casting’-to make real-time deductions on population distribution based on cellphone activity before, during or after a shock;
- Prescriptive (or diagnostic), goes beyond description and inferences to establish and make recommendations on the basis of causal relations, for instance by identifying the effects of agricultural diversification on resilience;
- Discursive (or engagement), concerns creating and shaping dialogue within and between communities and with key stakeholders about the needs and resources of vulnerable populations such as crowdsourcing maps to assist disaster reliefef forts.
Many view data driven approaches and attempts to gain generalizable insights as questionable: some argue that these approaches compromise contextual complexity and are not suited to adaptation policy questions. The adaptation community instead often prefers small-scale studies, which are largely composed of in-depth, context-specific insights on adaptation.
But it would be big mistake to dismiss big data approaches. For example, big data analyses can identify trends and certain locations that could be targeted for the design of ground-based surveys or interviews to understand adaptation choices and responses (for example, rebuild or relocate). Pairing big data insights with in-depth contextualized research can reveal deeper understanding of climate vulnerability, better inform early warning systems, and support more rigorous monitoring and evaluation, ultimately leading to more robust adaptation responses. Big data doesn’t just give the public pretty visualizations, it reveals facts about climate change that make a difference. Instead of knowing only that the climate is changing, data studies are showing how fast, where, and which industries are making it worse. How is data being used in the fight against climate change, and will it work?
Better climate models
Climate Informatics covers a range of topics: from improving prediction of extreme events such as hurricanes, palaeoclimatology (reconstructing past climate conditions using data collected from things like ice cores) climate downscaling, or using large-scale models to predict weather on a hyper-local level, and the socio-economic impacts of weather and climate.

They’re using ML to gain new insights from the massive amounts of complex climate simulations generated by the field of climate modelling. Of the dozens of models that have since come into existence, all look at data regarding atmosphere, oceans, land, or ice. One study uses machine learning algorithms to combine the predictions of the approximately 30 climate models used by the Intergovernmental Panel on Climate Change. Better predictions can help officials make informed climate policy, allow governments to prepare for change, and potentially uncover areas that could reverse some effects of climate change.
Showing the effects of extreme weather
Some are already experiencing the effects of a changing environment. For others, it might seem less tangible. To make it more realistic for more people, researchers from Montreal Institute for Learning Algorithms (MILA), Microsoft, and ConscientAI Labs used GANs, a type of AI, to simulate what homes are likely to look like after being damaged by rising sea levels and more intense storms.
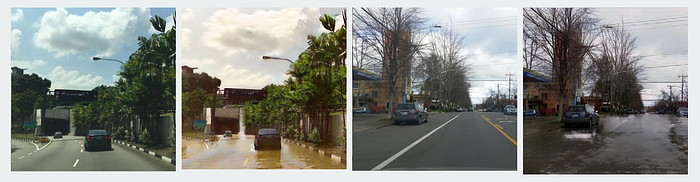
So far, MILA researchers have met with Montreal city officials and NGOs eager to use the tool. Future plans include releasing an app to show individuals what their neighborhoods and homes might look like in the future with different climate change outcomes. But the app will need more data, and their researchers recently allowed people to upload photos of floods and forest fires to improve the algorithm.
Measuring where carbon is coming from
Carbon Tracker is an independent financial think-tank working toward the UN goal of preventing new coal plants from being built by 2020. By monitoring coal plant emissions with satellite imagery, Carbon Tracker can use the data it gathers to convince the finance industry that carbon plants aren’t profitable. A grant from Google is expanding the nonprofit’s satellite imagery efforts to include gas-powered plants’ emissions and get a better sense of where air pollution is coming from. While there are continuous monitoring systems near power plants that can measure CO2 emissions more directly, they do not have global reach. ML can automate the analysis of images of power plants to get regular updates on emissions. It also introduces new ways to measure a plant’s impact, by crunching numbers of nearby infrastructure and electricity use. That’s handy for gas-powered plants that don’t have the easy-to-measure plumes that coal-powered plants have.
Carbon Tracker will now crunch emissions for 4,000 to 5,000 power plants, getting much more information than currently available, and make it public. In the future, if a carbon tax passes, remote sensing Carbon Tracker’s could help put a price on emissions and pinpoint those responsible for it.
Sources